See who buys, and why.

Every step people take on your website and app, tracked and clearly labelled, so you know who buys, where they come from and where they give up.

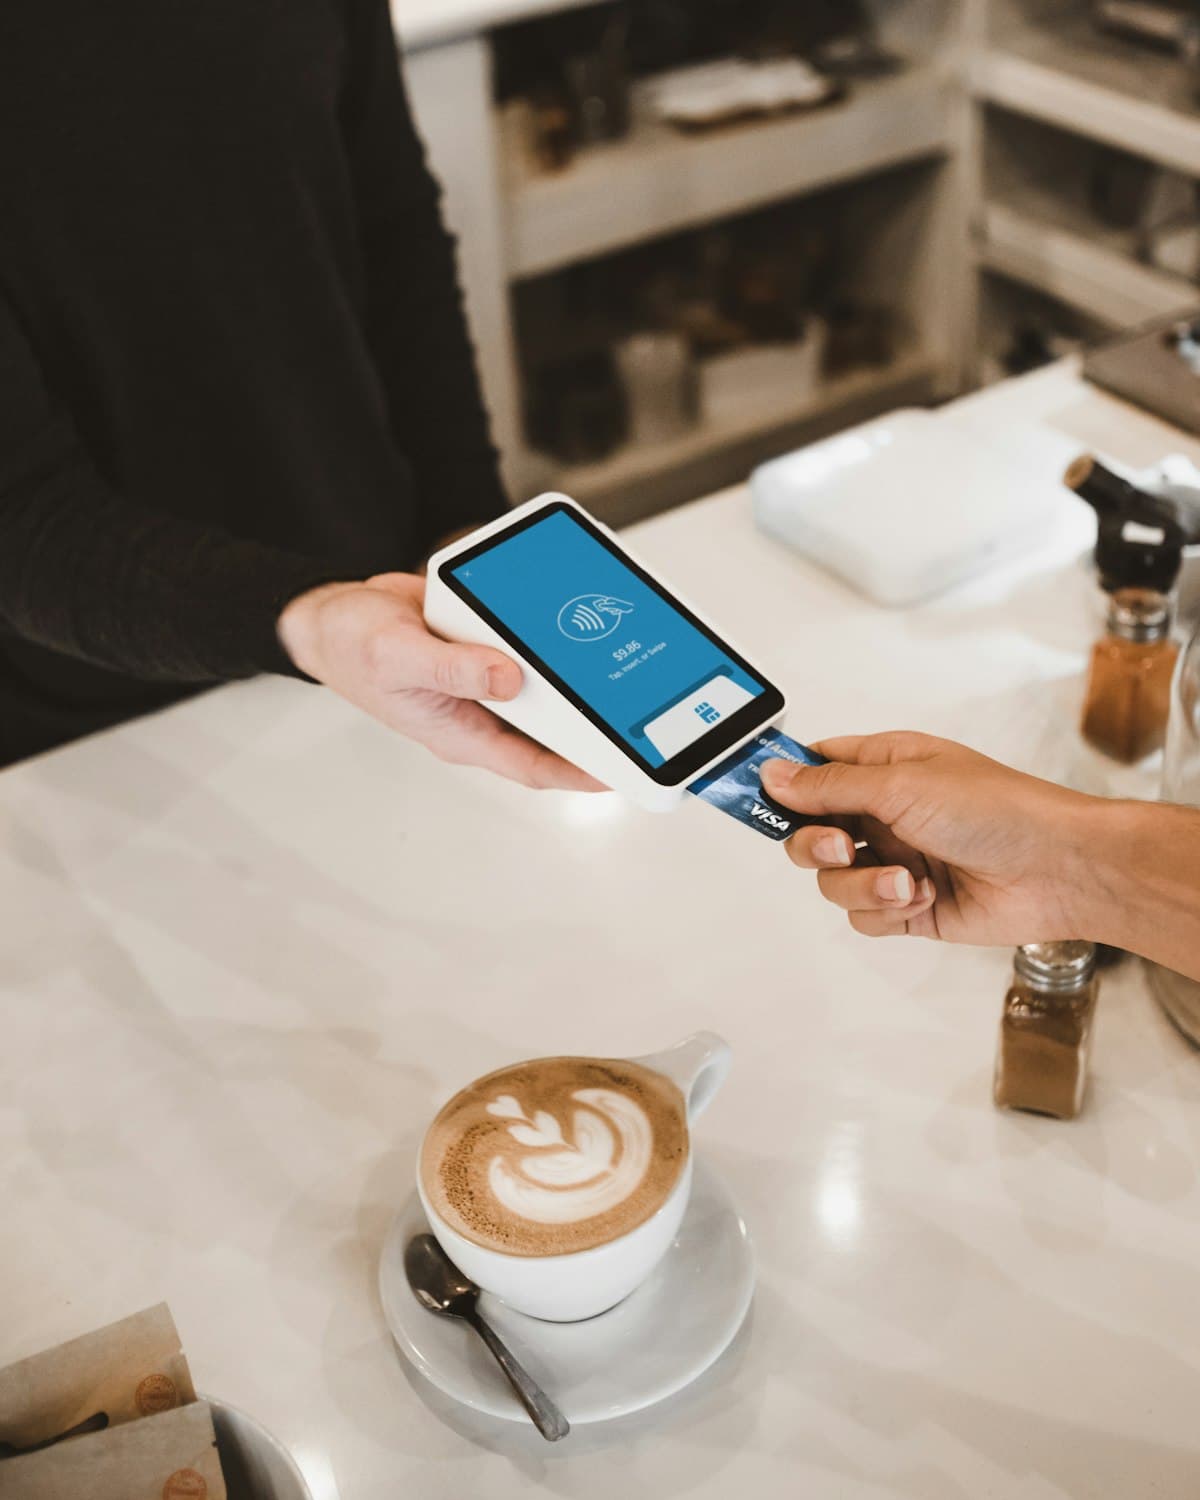
A customer paying by card at a café counter, a latte beside the terminal

What we report

  • Page views (not what we judge you on)
  • Bounce rate (not what we judge you on)
  • Who buys, and why

96%orders visible to Meta · skincare brand

Right now your best customer and your worst one look the same in your reports. We make the difference plain to see.

  • VisitorsCounted
  • SalesCounted
  • Which visitors became your best customers?Unknown

One client, three months

New customers for less, once Meta could see the sales it was already making.

A Shopify skincare brand where Meta could only see about six in ten of the orders its ads were producing. We fixed the tracking before touching the budget, and a campaign that was first in line to be switched off turned out to bring in the customers most likely to buy again.

of orders now visible to Metaorders seen by Meta
96%
return on ad spend
+41%
cost per new customer
−23%
Read the full case study
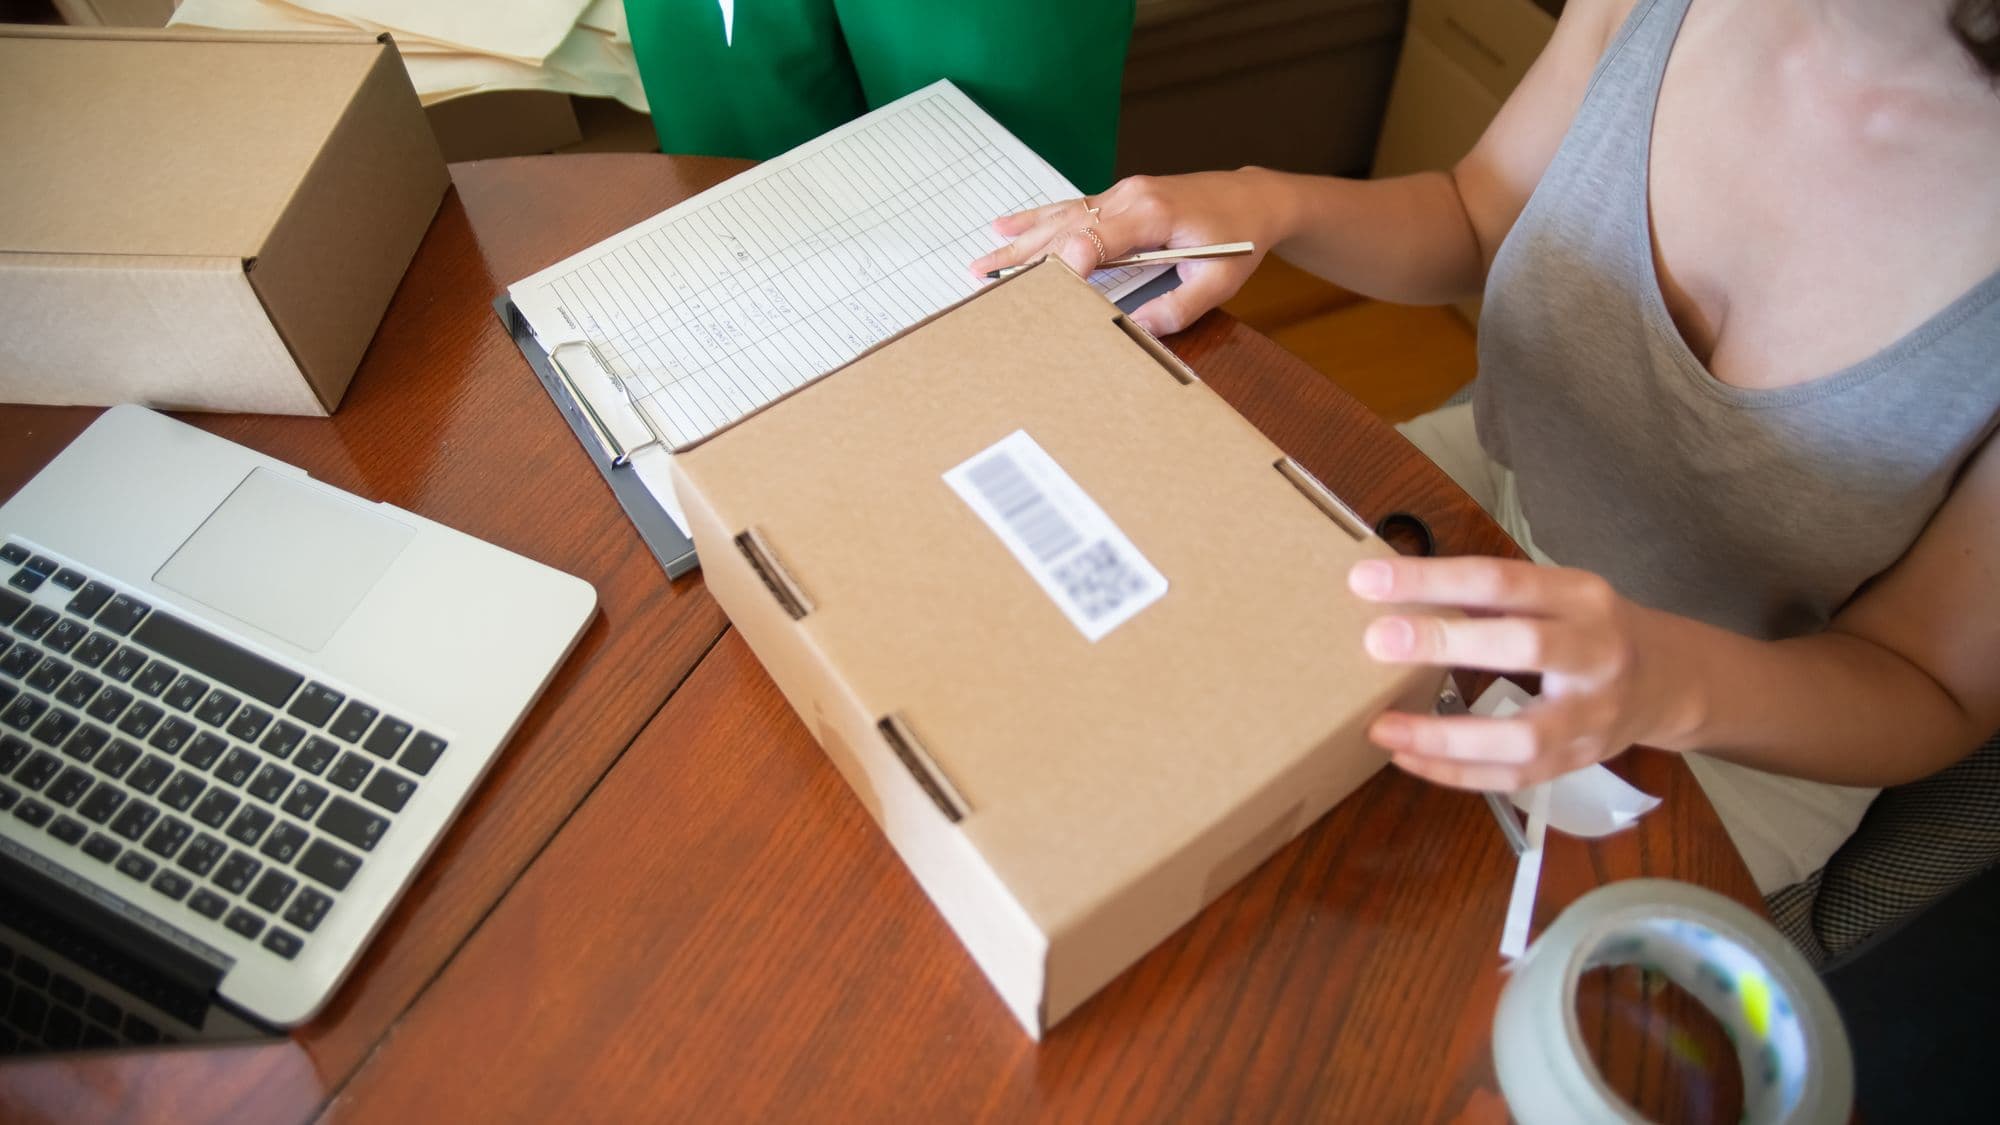
Two people packing online orders into boxes in a small business workspace

Orders Meta could see

BeforeAbout 62%

AfterAbout 96%
What you can answer afterwards

Six answers about your customers, every month.

Each one measured through to revenue, not to page views.

  • You can answer

    Who your best customer is

    By what they did, not by what they filled in on a form.

  • You can answer

    Where people give up

    The exact step, on the exact device, on the exact day it started.

  • You can answer

    Which channel actually pays

    Measured through to revenue, not to clicks or to what the platform reports about itself.

  • You can answer

    Who comes back, and why

    Return visits tied to what happened on the first one, so retention becomes something you can act on.

  • You can answer

    What a customer costs you

    One number, defensible, updated every month.

  • You can answer

    Whether this month was good

    Once a month, in writing: what changed, what caused it, and the first thing worth doing about it.

In more detail

Start with the part you need most.

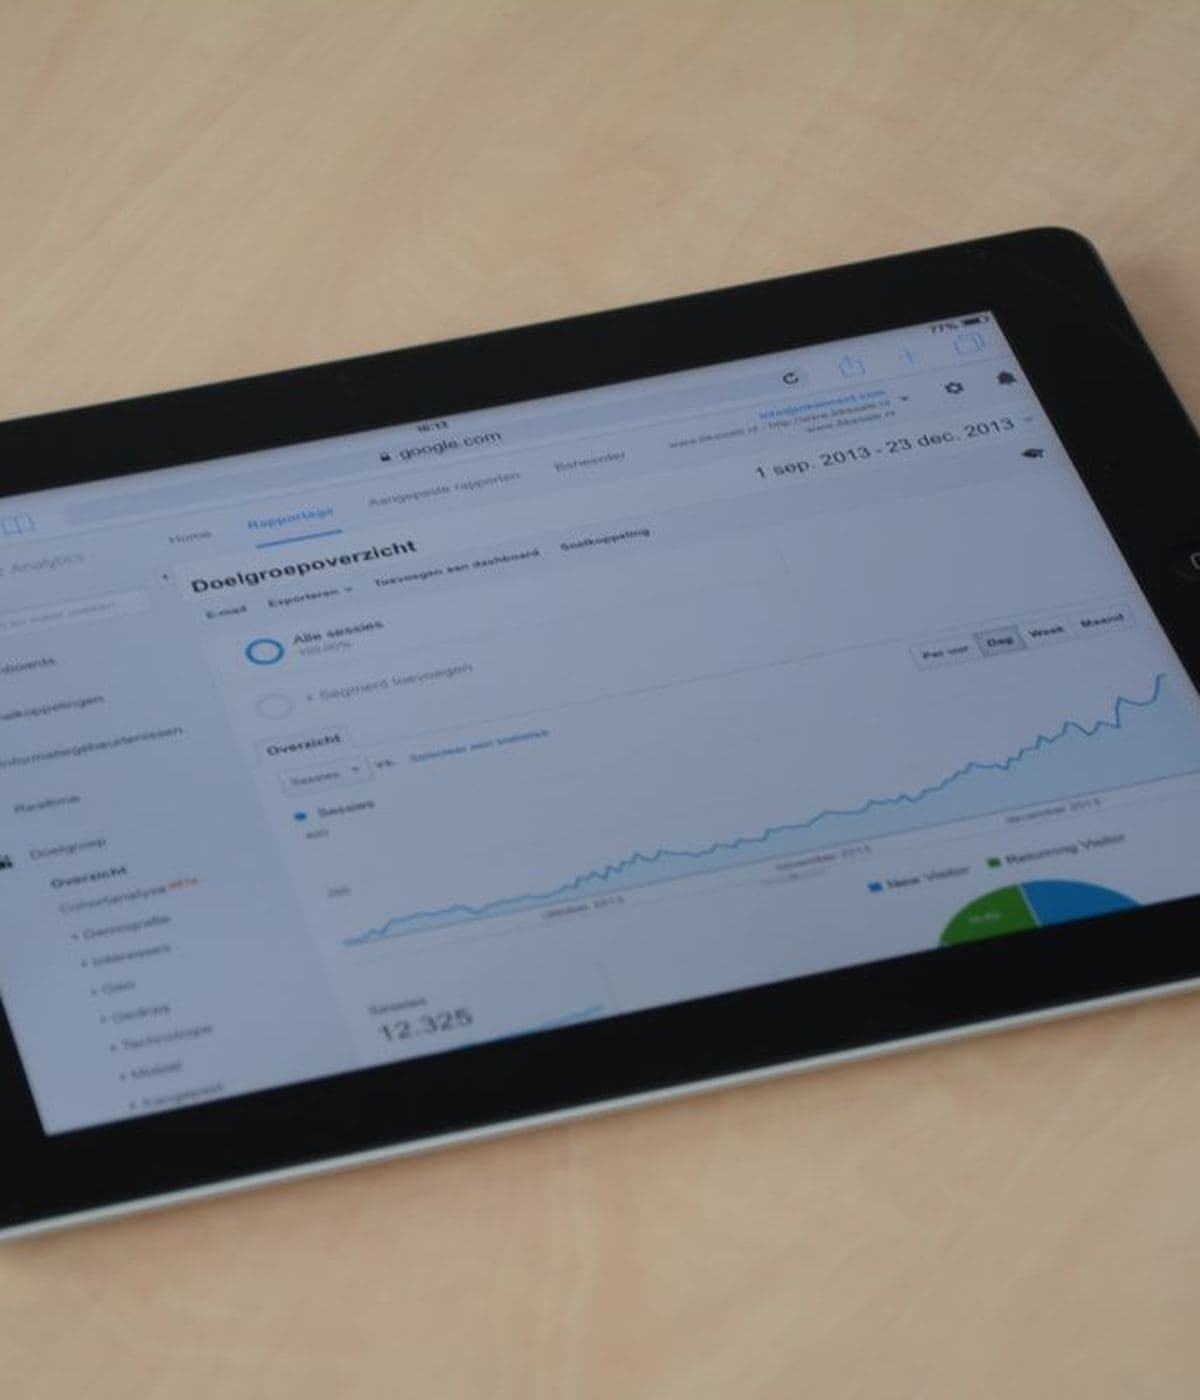
  • A tablet on a wooden desk showing an analytics report

    Analytics setup

    Most analytics setups record everything and explain nothing. Ours starts with the questions you need answered, and measures only what answers them.

  • A customer paying at a shop counter while the assistant scans an item

    Conversion tracking

    Every ad platform marks its own homework. We count each sale, call or booking once, and show you which ad to thank for it.

  • Someone working at a laptop showing charts, with a second screen beside it

    Reporting and dashboards

    A dashboard nobody opens is a cost, not an asset. This is built around the decisions you make, and it comes with somebody to read it.

Someone reading a dashboard on two screens at a desk
The first monthThe first month is mostly reading. What the numbers say, and what nobody had noticed they were saying.

What we actually set up

Everything we set up, in plain view.

The same work in technical terms, so you or your developer can check it against anyone else’s quote.

  • A Google Analytics 4 property, configured from scratch rather than inherited
  • Google Tag Manager on the website, with a written tag plan
  • Firebase Analytics in the Android or iOS app, sharing the same event names
  • A named event (a tracked action, such as "started checkout") for every step that matters, in your business's own words
  • Custom dimensions for your vocabulary: plan, region, account type, whatever you sort customers by
  • Funnel and retention reports built around those events, not the defaults
  • Conversions (the sales, sign-ups and bookings you count as wins) checked against the revenue you actually banked
  • Cookie consent handled properly, with Google's Consent Mode wherever your customers' local law requires it
  • A written event map, so the setup survives us leaving
  • A monthly read: one page, plain language, what changed and what to do

FAQ

The questions we hear most.

No. Measurement scripts load after the page, and an app event is a few bytes sent in the background. We check the page speed figures before and after, and publish both to you.

Your turn

Bring the question your reports cannot answer.

Tell us about your business in a few minutes. We will reply within a working day to say whether it is measurable, roughly what it would take, and whether we are the right people for it.